Weather stations, loggers and fixed instruments send readings through the Data Logger, the API or a file upload. Each reading keeps its time, place and units, so ten years of a station sits on one time axis, ready to compare.
Connect a sensor →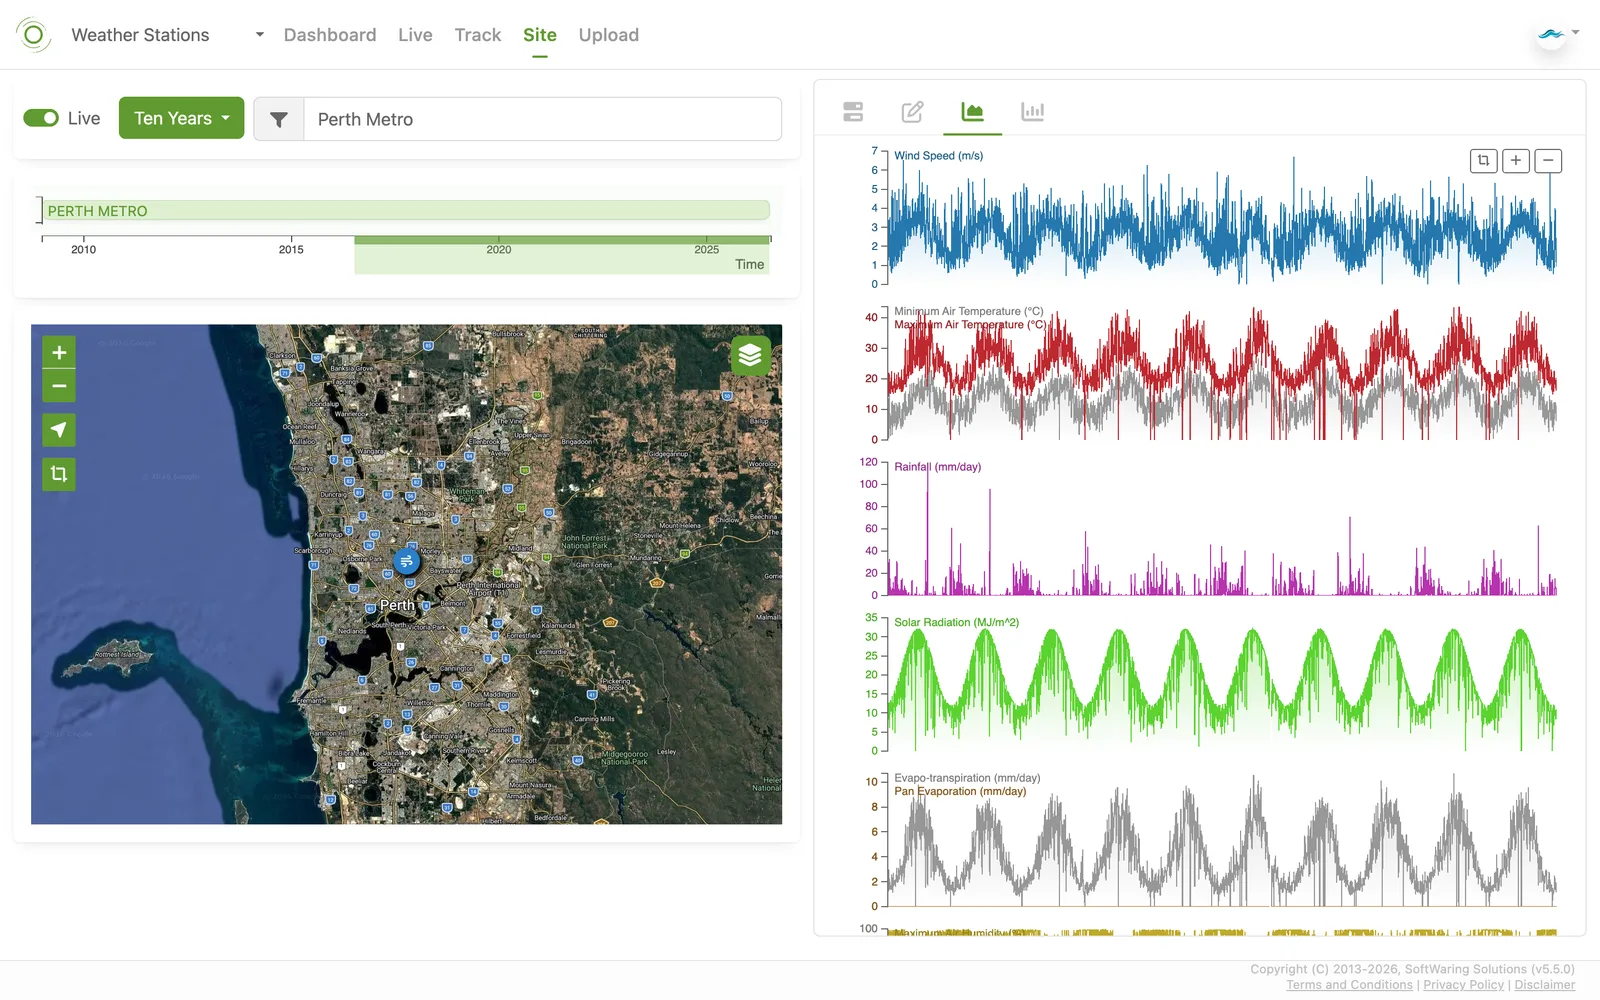
inMotion Track records where you go and what you measure along the way, from the phone's own sensors or a connected one. Walk it, ride it, or mount it in a truck or on farm machinery. Every track keeps its route, time and units.
See the app →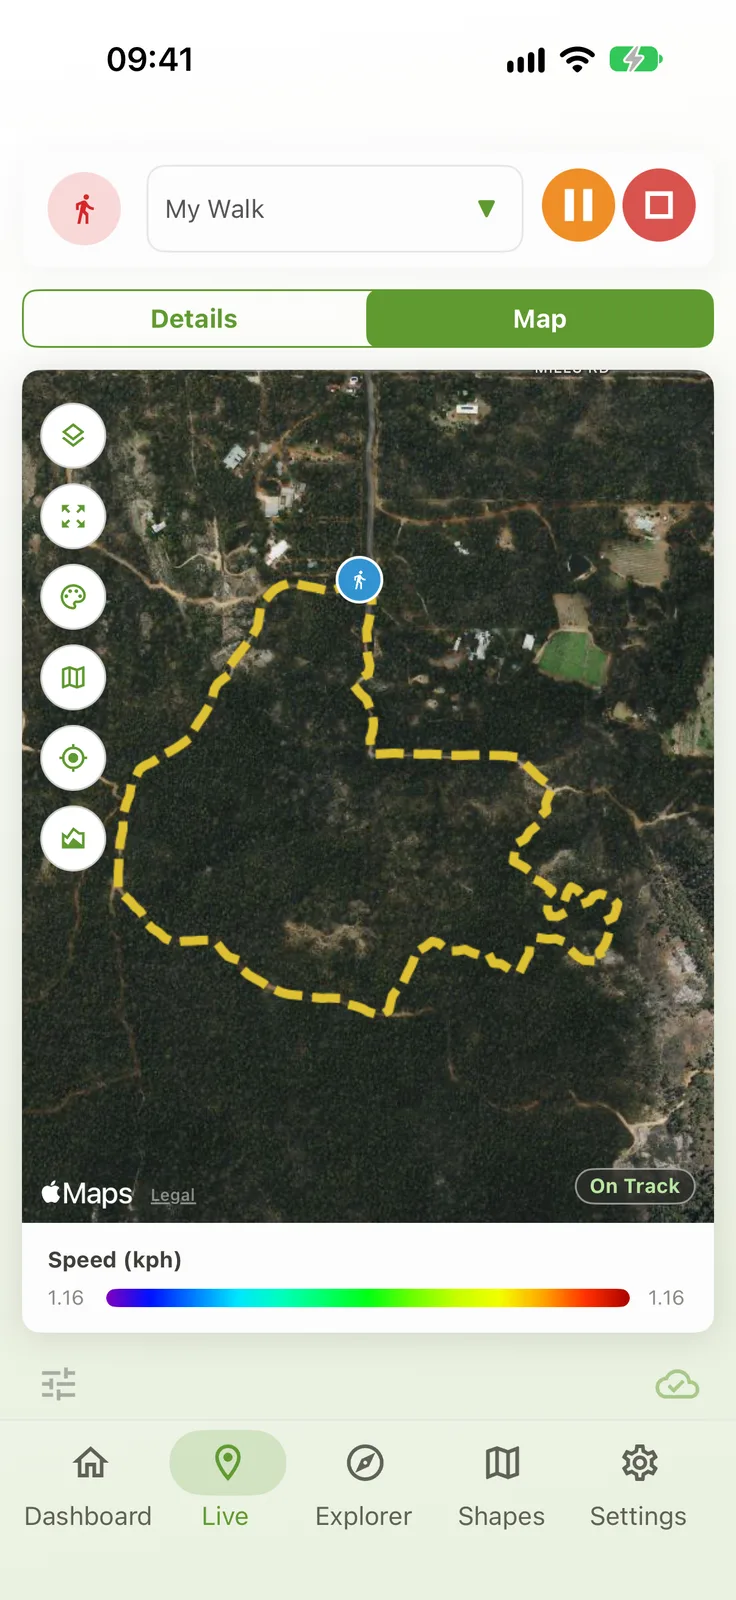
Tracks, sites, shapes, grids and model output together, searchable and on one time bar. Pick a few layers and review them side by side.
See Explorer →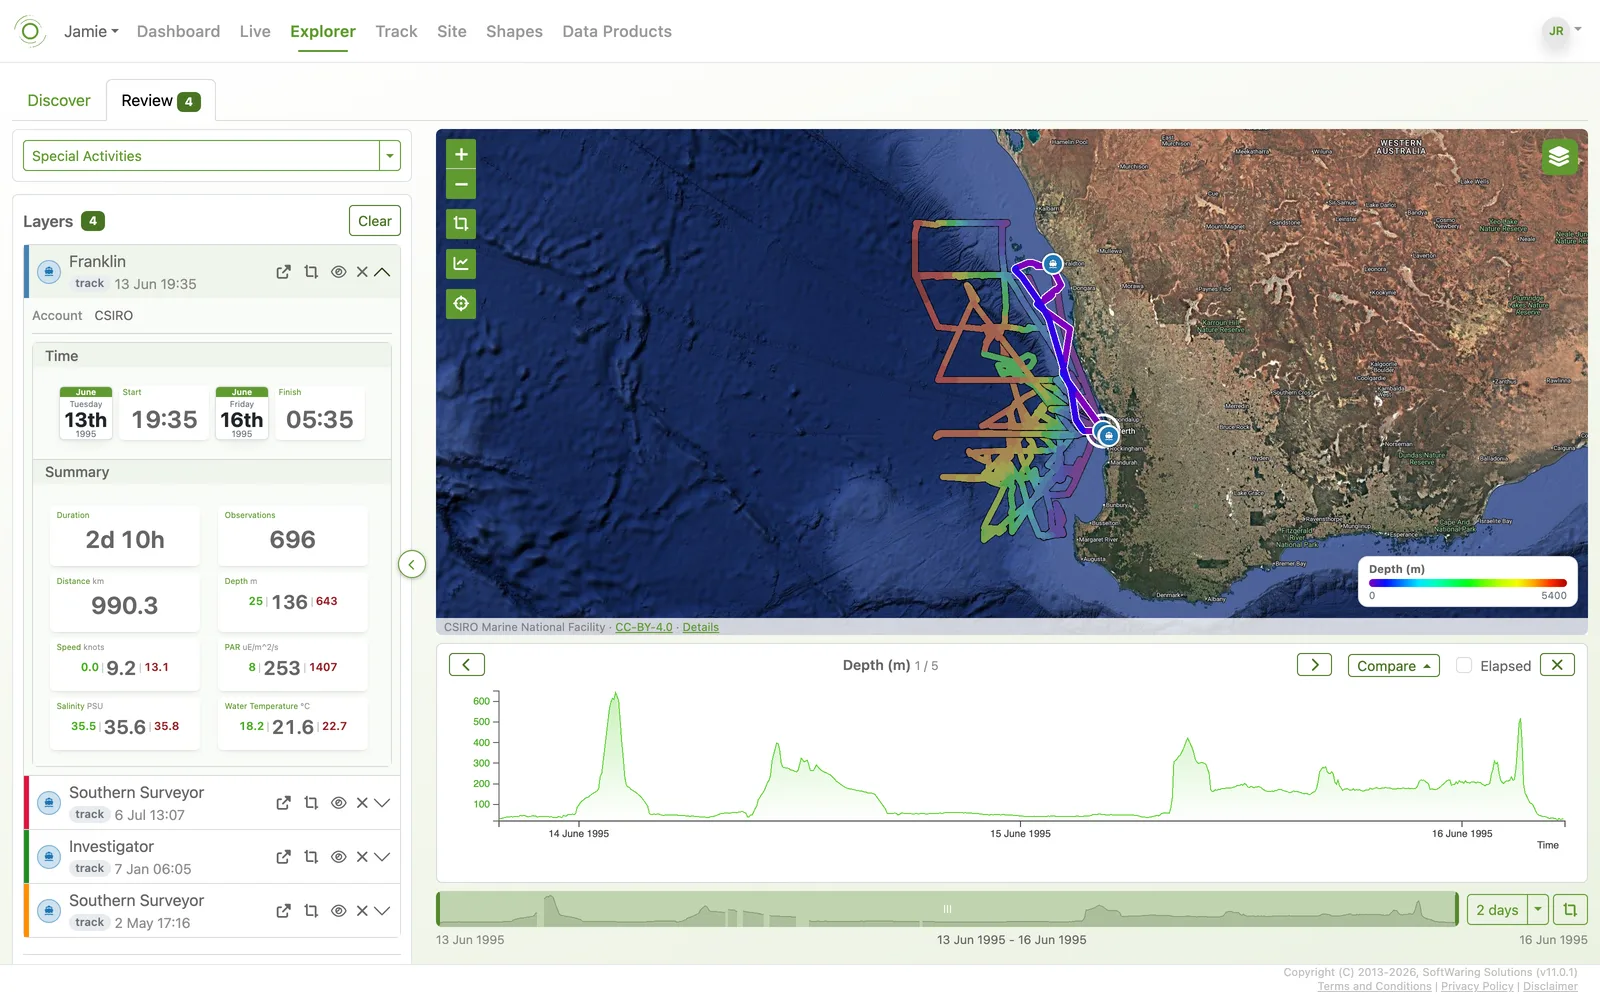
Add a model run, a satellite product or any gridded Data Product, then set it against a ship's track or a weather station in the same place and time. See where they agree and where they don't, without leaving the map.
See Data Products →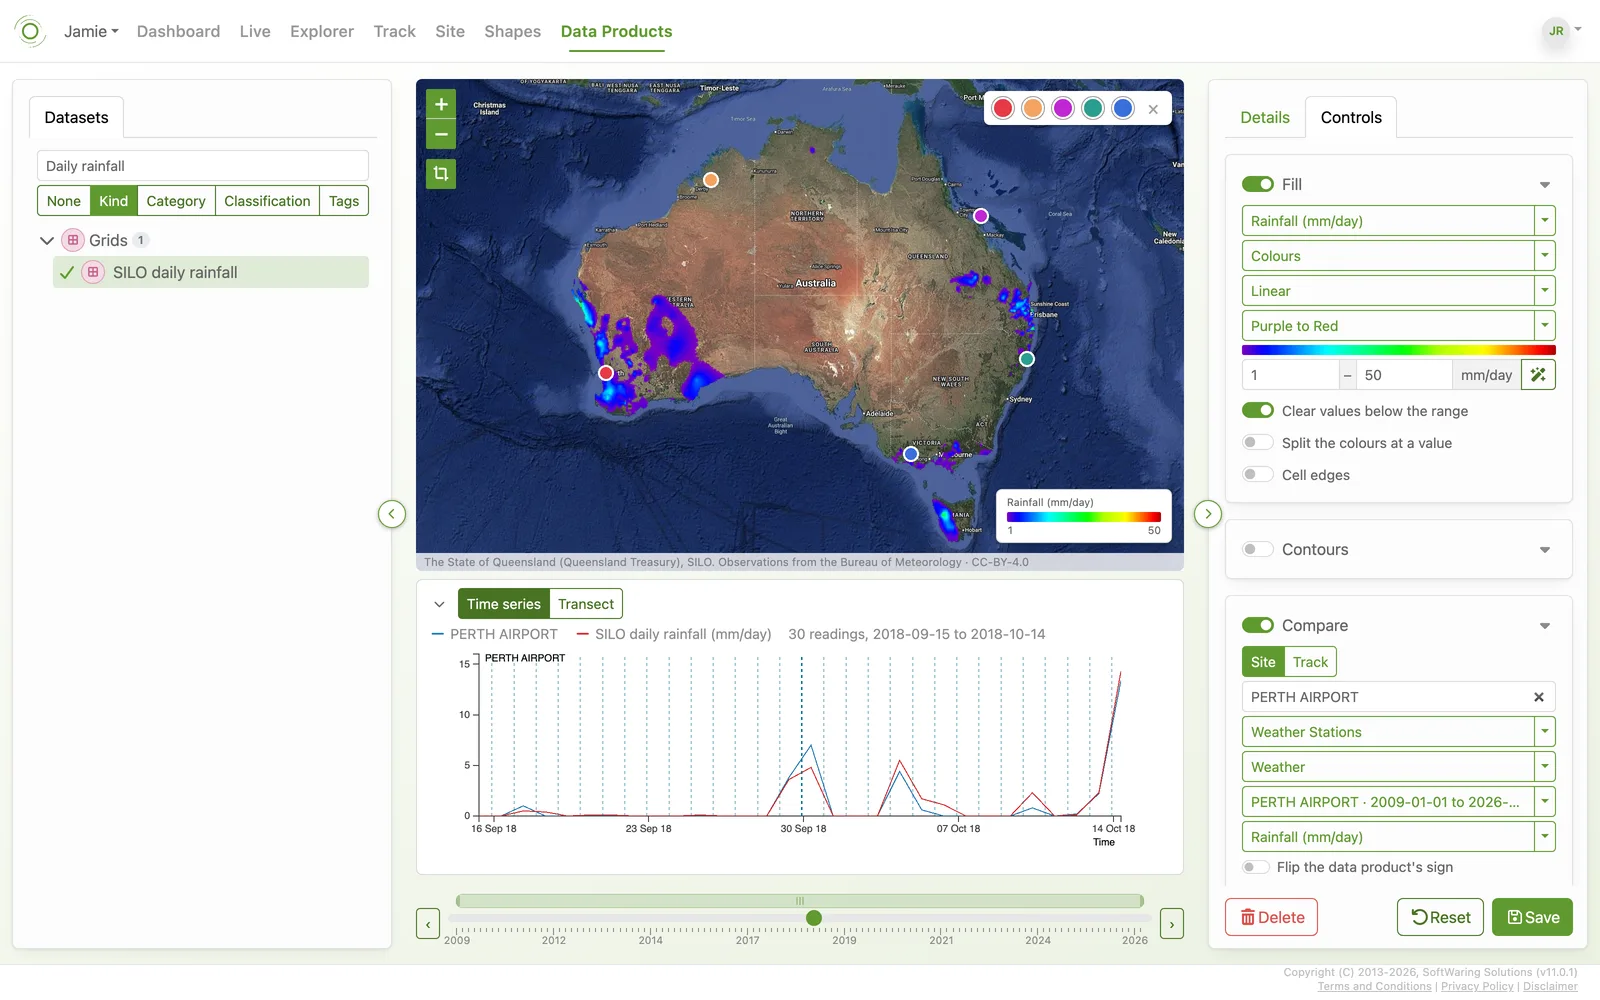
Serve your gridded Data Products to QGIS as map layers, or read and write everything through the REST API and the Python SDK.
Data in GIS software → The Data Platform →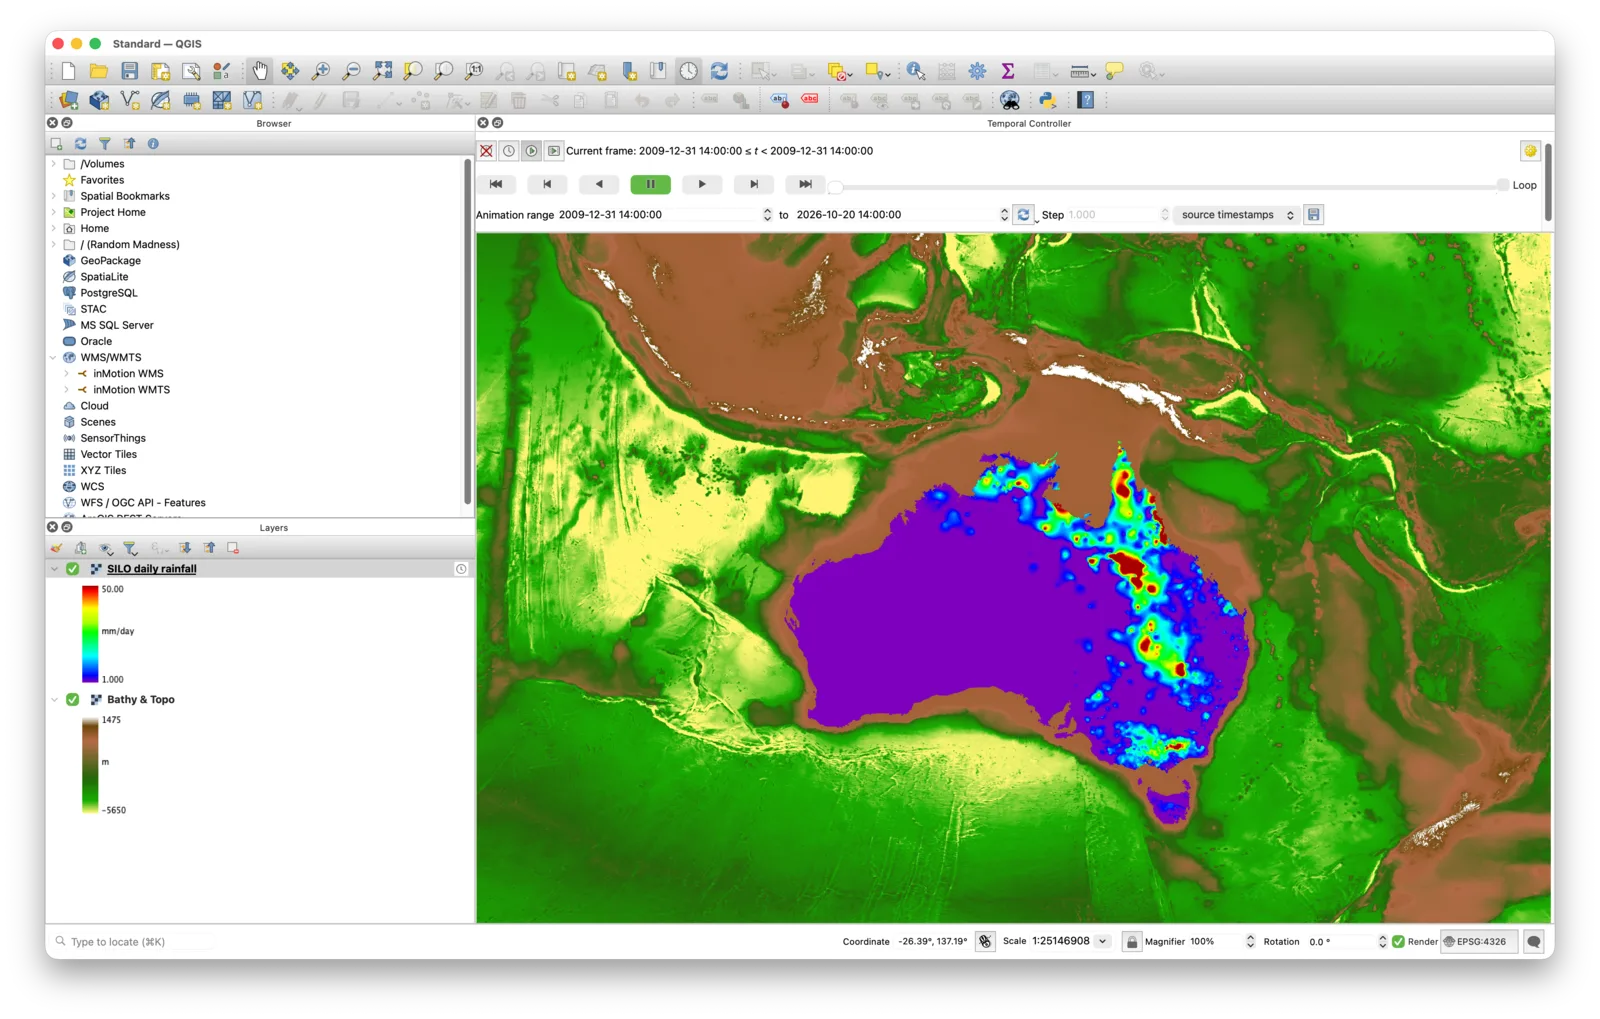
Your historic records can be imported quickly, from CSV, GPX and more, using drag & drop upload, the SDK and the API, and soon inMotion's MCP. Beside today's readings they become something you can see, compare and use again.
inMotion manages and presents your data. You bring it in by upload, the Data Logger, the SDK or the API.
Environmental Monitoring
Stations, gauges, sensors and satellite products with a record that lasts.
Marine and Atmosphere
Voyages, moorings, weather and ocean models in one view.
Remote Assets
Pumps, tanks, bores and vehicles reporting from wherever they are, with a record you can review.
Agriculture
Paddocks, machinery and weather side by side.
Build Your Own Products
Manage the data behind your models and applications, publish the results as Data Products and validate them against real observations.

